What we do and how it works
Strategic asset allocation over the long-term (saalt) has been developed to translate the best available economic-financial modeling into a guiding framework for actionable asset allocation and financial planning. The project will enhance financial literacy and will enable anyone to understand the key components which must be taken into account when thinking about financial planning, investing, and retirement planning. While we have tried to make this tool understandable to everyone, it has been constructed by consolidating quite technical academic work. Hence, in order stay true to a basic principle of the platform – transparency of methodology -, the following text provides details of the modeling framework. Although the text is slightly technical at times, it will support understand important steps in the thinking process. Bear with us.
Why you always need a model
It is a dangerous fallacy to think that the same investment advice can be given to different people. This is particularly true if individuals are dissimilar in age, financial situation, objectives, or general preference for risk. The importance of models in creating frameworks to guide us, individuals, investors or policy makers, in the decision making process is recognized in the diverse fields of science. A good example is given by a recent piece published by Paul Krugman, an economics laureate, in the New York Times on the importance of models in guiding policy (link).
When working on your financial planning, such things as investment-horizon or your objectives are crucial. If you are planning to save and keep those savings safe for a house down-payment in two years, than your investment portfolio should certainly be a lot less volatile than someone who is saving for retirement, twenty years down the road. Or if you are a recently employed university graduate, a steady employment income should allow you to better absorb temporary downturns in your financial wealth due to capital market fluctuations, compared to someone already in retirement and dependent solely on the past accumulated wealth. Furthermore, while it can be shown that investments with higher risk and return might statistically dominate less aggressive investment strategies over the long term, if a person is very risk averse, all the financial market fluctuations could cause more detriment to this person’s wellbeing than a higher financial wealth at a later stage in life. Hence, aversion to risk is an important component to consider when deciding on investment strategy.
For all the named reasons and a long list of additional ones, financial planning decisions need a guiding framework. Saalt believes that a good tool to compare and check your financial planning is offered by economic models focused on dealing with household finance, more precisely with life-cycle theory. This field of research has for decades analyzed the behavior of individuals and households in their effort to smooth consumption over their lifetime, and it has developed a series of theoretical models that provide a tractable way to optimize this behavior – to learn more, move down to the detailed sections below.
Building a hybrid
combining the best of machine optimization with human insight
While a computer is a great optimization tool, it has no views about future market developments. Of course, many modeling exercises just use past capital market performance to project future development, but we know that the past is only a mediocre predictor of the future. A good example here is the price developments seen in the commodity markets, particularly the oil market. If we were to use the recent history as a guide, we would be expecting a continued large devaluation, something a series of experts would assume to be unreasonable.
In order to overcome this problem, we have set up saalt to be a hybrid between machine optimization and expert insights and expectations about future economic and financial market developments, in which the investment committee will be the source of insights for the projections of future developments. The following sections will characterize the main features and the interactions of the machine optimization and the experts’ insights.
Model – machine (Optimization)
The core of our modelling framework is based on household finance and the life-cycle theory, and a conviction that individuals can and should optimize their financial planning given an array of personal characteristics and circumstances. Nonetheless, some people do not have standard income dynamics. These people include freelancers, artists, non-working spouses, writers, and many others. For those, and others who might not wish to disclose personal characteristics, we have developed an investment targeting tool that works with simpler mechanics.
Target investing
The user is given a tool to visualize probabilities of reaching a targeted investment amount, given a starting investment level, a time horizon, and a choice between different potential expected returns and standard deviation combinations of a broadly diversified portfolio (market portfolio) and a safe asset. Once these parameters are chosen, a Monte Carlo simulation is run, which generates the potential outcome distribution and the probability of reaching the envisaged target.
Household finance and life-cycle theory
Consumption Smoothing
In the early 1950s Nobel Laureate Franco Modigliani began studying the consumption and investment decisions of individuals and households. He realized that people adjusted their spending and saving behavior to both the available resources to them over their lifetime as well as to their current stage in life. It became clear that there is a pattern of building up a stock of assets in the earlier phases of life, which could then be used in the later stages, particularly after retirement, when there no longer was a regular flow of income. This behavior is generally termed “consumption smoothing” in the economic literature.
Within the field of economics, there has always been the tension between the camp focused on determining and estimating the behavior of individuals assumed to be fully rational in their choices, which forms the field of “positive economics”; and those academics who work on creating models to support and correct imperfect choices (“normative economics”). This platform’s approach is to provide users with a model framework, which can generate optimal asset allocation and savings suggestions based on the individual’s characteristics, so as to allow him/her a comparative benchmark and a tool to assess the sustainability of current saving behavior. To a certain extent it keeps up the tension between the two camps by making use of insights from both sides and presenting them in a way which helps individuals in their financial planning decisions.
Labor income dynamics
A key component of proper financial planning in the context of a life cycle is to take into account the wage generated income stream. Since under normal circumstance this should be regarded as the most reliable source of income, it is worth analyzing it with a bit of care.
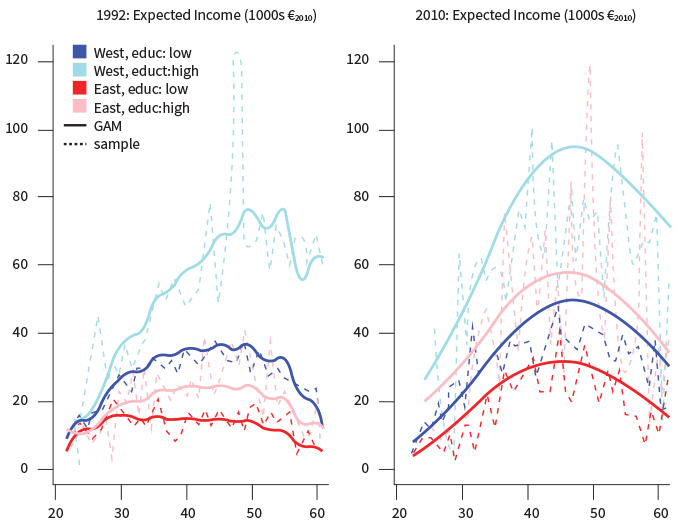
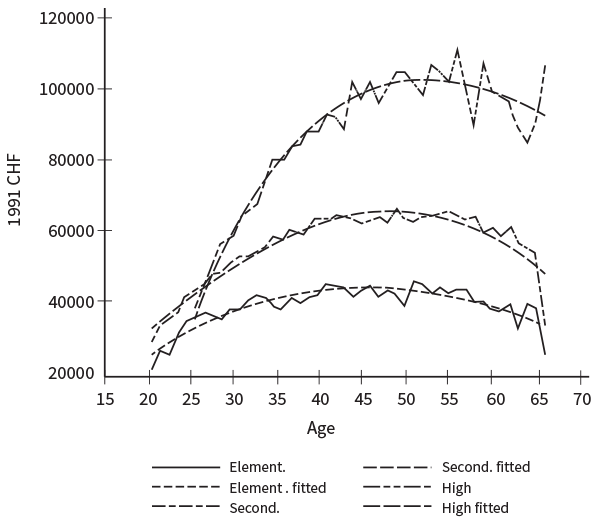
A first important characteristic is how an individual should expect income dynamics to be in the course of a lifetime. Here, empirical data available from sources such as the US Panel Study of Income Dynamics (PSID), allow estimating a general pattern of income across the various household cohorts. By following estimation procedures by Campbell, Cocco, Gomes, and Maenhout (2001) and Carrol and Samwick (1997) and using the PSID data, one gets a good idea of how income dynamics evolve over time and how they are different for people of different education levels. As one can clearly see, and probably would expect, college graduates have a steeper salary increase and end up at a higher overall average income level, when compared to persons with lower levels of education. Broadly similar patterns can be identified across countries. In the next figure, the case of Germany and Switzerland are presented, which are taken out of publications applying different estimation techniques, base years, and focused on other subjects, but the general similar dynamic becomes evident. Within Saalt’s modeling framework, the levels and nominal income values are not of importance (they would need to be adjusted for inflation and level shift over time), what will be used is only the growth trajectory of income for the different education levels estimated from the US PSID data. Once extracted, the underlying dynamics will be applied to the user-specific inputted current income in order to obtain the future expected trajectory.
The information on an individual’s income dynamics is particularly important when conducting long-term planning, because it will define how much income is available to consume, save/invest, and ultimately how an individual’s financial wealth is expected to evolve. Hence, spending some time on thinking about how that trajectory is likely to turn out is very useful. Of course, for many, the income curve will be a continuously upward trending slope. For those, the available income is higher than what is projected if using the growth dynamics in line with the PSID estimates. But one needs to bear in mind that for many people, the ages of the late 40s and early 50s mark a time where jobs change and salaries either stabilize or need to be adjusted downwards. Hence, when planning the financial future and thinking about sustainability of spending behavior, it is worth being prudent.
Germany (also comparing salary evolution in East and West); Sohn et al (2014)
Switzerland (males only), Zainhofer (2008)
Labor income as “safe asset”
A different way to look at labor income is to regard it as a safe asset, something an individual can rely on for the time he or she is fit to work. It is a reliable resource because, even if people do not always “land a dream job,” people are flexible and adapt their expectations to existent market conditions so as to make sure not to stay unemployed for too long. Hence, under normal circumstances, people can expect to earn a steady flow of income for the period of their working age.
When thinking about it, a bond has very similar characteristics, it delivers a steady flow of coupon payments until maturity. The pricing of a bond therefore discounts all future cash flows to its present values in order to obtain a measure of how much it is worth today. The same discounting cash flow approach can be applied to a person’s expected income flow in order to obtain the present value of the asset called “ability” or “human capital”. That asset is obviously not tradable due to the risk of moral hazard – i.e. a person selling the asset and immediately thereafter stopping to work – and the impossibility and immorality of contracts which would force a person to work. Nonetheless, for an individual, one’s “human capital” should be treated as a valuable asset.
When holding on to the image of labor income as a valuable asset, it is clear that this ability is worth the most early on in someone’s career, since at that time the majority of one’s paychecks still lies ahead. At the same time, the accumulated financial wealth is still small, since there has been no time to save and invest. The figure on the right hand side presents a summarizing example of this concept: at an earlier age, the person’s wealth lies in his or her ability to work, and, as time goes by, financial wealth rapidly increases its share in total wealth. Therefore, and due to the fact that labor income has many characteristics of a safe asset, it is advisable for a young person to have a larger portion of financial wealth allocated to assets with a higher risk-return profile. This argument holds not only for the aim of trying to have a broadly balanced lifetime risk-profile, but also because a younger person has more time to recoup any potential temporary shock to financial market performance.
Risk preferences
Finally, incorporating someone’s appetite for risk is certainly among the most important components in financial planning. That is the reason why most advisory tools stress this component – although often neglecting other named components above, which in many instances might even be of higher order of importance.
Identifying a person’s risk preference profile is extremely difficult, and a whole branch of academics from the fields of economics, finance, as well as psychology have produced interesting research on this – a small bibliography can be found below. Interestingly, research has found that people tend to have different risk preferences depending on the environment in which the test takes place. But not only that, the type of payoff in a gambling environment also has an important influence on the estimated result. Saalt tries to keep the type and quantity of questions within a tractable framework, using only three questions but designing them to cover different testing backdrops. The output is then averaged and linearly mapped into the width of relative risk aversion parameters used in Campbell and Viceira (2001).
Existent financial wealth
The capacity to smooth today’s and future consumption will be considerably influenced by the existence and size of accumulated wealth. Concomitantly, built-up capital will influence the current and future size of the saving rate. The concept is rather intuitive: if at some point in time a person has built up a considerable amount of wealth, then the need to save is less pronounced. Within Saalt’s modeling context, consumption is a function of income and wealth, as well as other parameters.
The model also finds target ratios of financial wealth to labor income for investors. That target ratio can increase from about three to over twenty. The increase is driven particularly by the degree of risk aversion of an individual. In practical terms, this means that one should expect someone with an intermediate risk aversion profile and some twenty years to retirement to achieve a target financial wealth that is something around 12-14 times the income level. While these ratios seem rather large, it is important to bear in mind that the model assumes all of an individual’s consumption will have to be financed solely by accumulated wealth – there is no expected other income flow once retired. That is why the platform allows a user to input his or her expected additional future income streams so as to allow a greater degree of tailoring.
Using all ingredients to achieve the right balance between market portfolio and safe asset
All the components discussed above are crucial input variables in any serious attempt to tailor financial planning and asset allocation. The modeling framework we have used draws heavily on the great research work by Professor John Campbell, University of Chicago, and Luis Viceira, Harvard University. Particularly their book “Strategic Asset Allocation: Portfolio Choice for Long-Term Investors”, published in 2002, has been enormously helpful in building the right foundations, and it provides a great read for anyone interested in deepening their knowledge in the field. Other research been processed directly or indirectly in this financial literacy platform. The full list of publications can be found at the bibliography at the bottom of the page.
Contextualizing the issues in a specific example
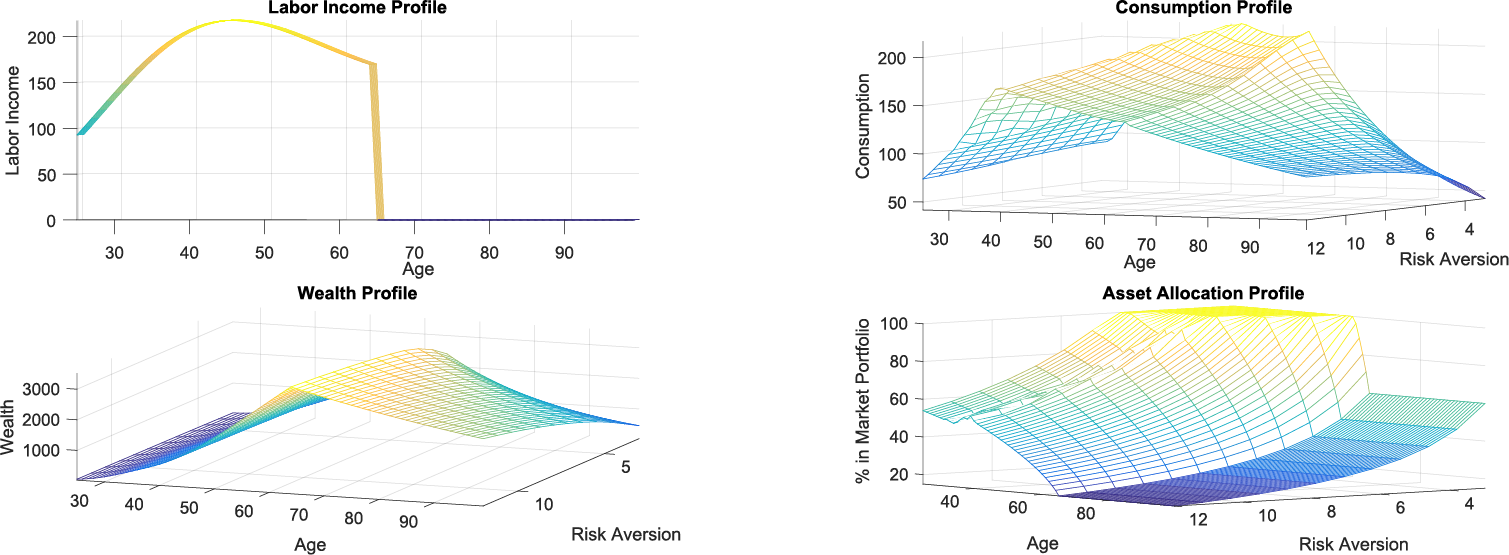
Finally, in order to bring some of these discussed items to life, it is useful to pick a practical example to illustrate the optimization results. The figures below have been generated by running an optimization procedure for a person aged 25, with a university degree, a yearly salary of $84,000, and a financial wealth of $45,000.
The upper left hand side figure shows the expected income trajectory, in line with the estimated income dynamics presented in the labor income section. The model assumes that retirement sets in at age 65 and there will be no pension income. The picture on the upper right hand side shows what the model generated optimal consumption profile should look like for the different types of risk appetite (z-axis/3-D axis), whereby a larger number implies a greater risk aversion. As one would assume, an individual with a greater affinity for risk, will also consume more and save less. The figure on the lower right also resonates that result by showing that more risk-prone individuals should allocate a greater portion of their financial assets into the portfolio with a higher risk-return profile (i.e. the market portfolio). Finally, the figure on the lower left synthesizes all of the information and decisions taken by that individual by showing the different financial wealth trajectories. Clearly, wealth accumulation will depend on income dynamics for a great part, but also on consumption and investment patterns. One can see that individuals with less affinity for risk will tend to accumulate more wealth throughout their working life and will also make sure to have a sufficiently large buffer for any emergency.
Model – human optimization (Investment Committee)
As described in the previous section, the clearly specified modeling framework allows the computer to find the optimal consumption/saving and asset allocation strategies for a wide range of possible individual specific characteristics. In terms of asset allocation, the machine optimizes between a safe asset with an expected return of 2.5% per annum, and a market portfolio with an expected return of 6.4% per annum. These expected returns have been calculated on long-term historic averages, and so have their respective used volatility levels.
Composition of the Market Portfolio
The important question, then, is what should be the combination of assets in the market portfolio and why. To answer this question, it is interesting to elaborate on a few of the main and widely applied models in finance.
“Modern Portfolio Theory”
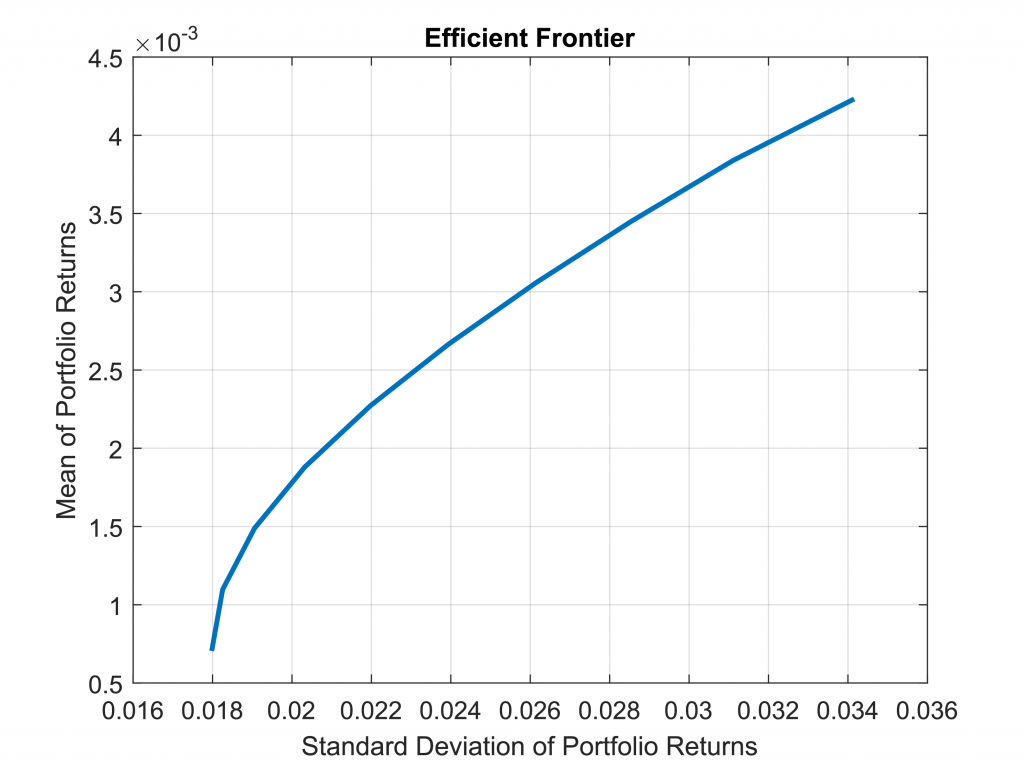
This theory deals with the problem of how to maximize return for a certain level of risk. Or, equivalently, how can an investor minimize her portfolio volatility for a certain level of expected return. Harry Markowitz introduced the main concepts in the early 1950s, for which he later received a Nobel Prize. Mathematically, the model optimizes the weights of a portfolio, based on expected variances, correlations, and return distribution probabilities of assets, so as to allow finding the portfolio combination that maximizes return for a given risk level. If pursuing the exercise for every level of risk, one achieves a respective continuum of maximized returns or the “efficient frontier”.
Tangency Portfolio
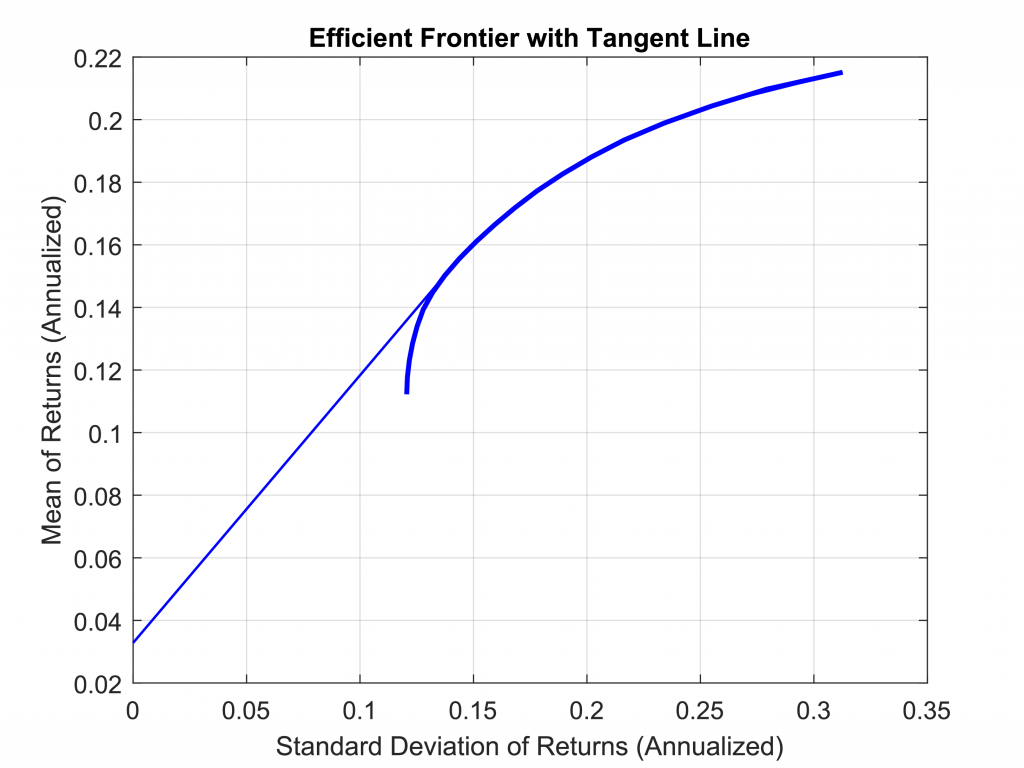
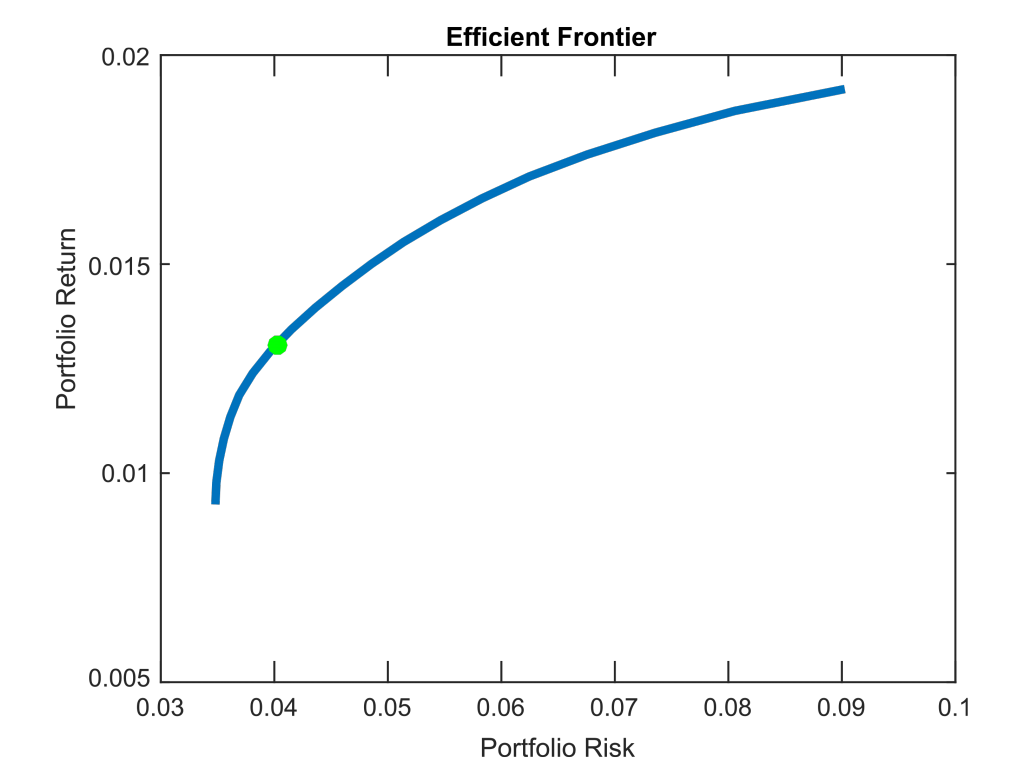
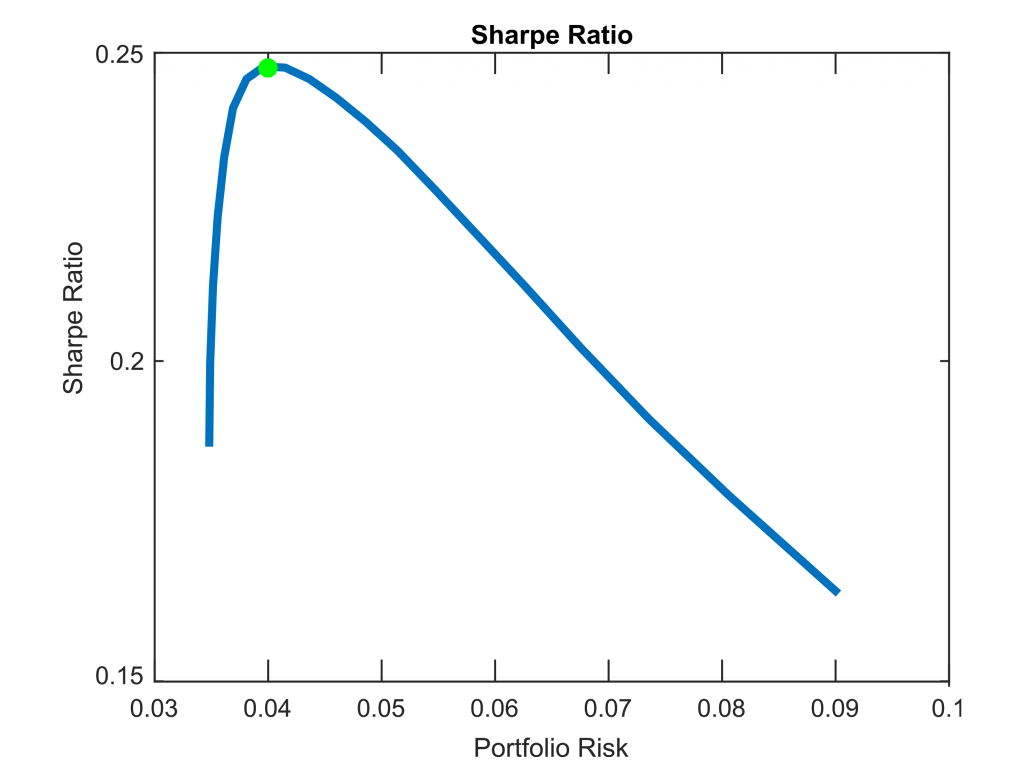
Now, adding a risk-free asset, in practice something like a government bond with short-maturity, allows one to expand the universe of risk-return profiles. The risk-free asset is assumed to have zero or close to zero variance. An interesting way to do so is by drawing a line from the risk free asset, which only touches the efficient frontier on one point. This “touching” point is commonly known as the tangency portfolio, and it denotes the point from which on the efficient frontier will no longer be on the hyperbola but rather on the straight line.
Interestingly, the tangency portfolio also represents the portfolio which maximizes the Sharpe ratio, or the risk-adjusted return, among all possible portfolio combinations in the universe of risky assets. The tangency portfolio is also called the market portfolio, since when assuming that market participants are rational, i.e. following minimum variance and risk adjusted maximized return, all investors should hold their risky assets in the same proportions as the weight in the market portfolio. The market portfolio is empirically identified as the weighted sum of all traded assets.
Identifying and adjusting the market portfolio
Having this theoretical insight as a backdrop allows us to look for a practical and tradeable market portfolio. The first step is to calculate the existent sum and weight breakdown of all assets traded globally. This has been done as a separate exercise and the main report can be found here [INSERT LINK to report on Global Market Portfolio]. Once the latest available empirical market portfolio is estimated, it serves as the foundation upon which the market expectations and views of the investment committee will be overlaid.
Adjusting weight of portfolio components
In their bi-annual meetings, the investment committee will evaluate the allocation of assets as presently found in the “global market portfolio”, defined as the weighted sum of every asset traded in the world. With the help of the Black-Litterman (BL) model of asset allocation, the calculated current asset class returns will be evaluated, discussed, and adjusted where needed. Once an agreement has been reached within the investment committee about the projected returns for each asset class in the subsequent year, the adjusted returns will then automatically adjust allocation weights using the BL framework.
Results – What the tool offers
There are a series of insights of great practical relevance that can be obtained from this platform. Here are some of them:
- Behavioral benchmarking. It allows a user to assess whether the current saving behavior allows a sustainable consumption pattern through time and to compare the resulting wealth dynamics to a model optimum.
- Offers a conceptual framework. Planning your finances and choosing the right investments is not easy, particularly in today’s world where investment advice is trumpeted out through all media channels. In order to make the right choices, a person first needs to understand the breadth of risks involved and the variables of relevance. The model framework here presents the main components that need to be taken into account when deciding on an individual’s investment strategy.
- Test the model as well as your views on the past. A crucial component to find the appropriate investment strategy is confidence. And to build confidence a person needs knowledge of the risks involved but also some practical experience. While on the one hand we provide the conceptual tools needed, saalt also gives you a chance to create individual portfolio combinations and see how those would have performed in the past. Comparing your own creations with international benchmarks, the global market portfolio, or the portfolio we suggest allows you to deepen your understanding and build confidence.
- Compare and discuss. A great deal of what we know has been acquired through interaction with peers, colleagues and friends. Saalt supports that learning channel by allowing users to share portfolios or invite participants to an investment challenge. This will allow assessing short vs. long-term aims, asset class performance in different volatility or business cycles, but most importantly different behavior patterns of individuals and the related payoffs. All of which will increase the experience and the confidence of the user.
- Building targets. Interesting recent research (Biljanovska and Palligkinis 2015) on the crossroad between economics and psychology shows the linkage between self-control and wealth. It is identified there that self-control consists of three main ingredients: planning, monitoring, and commitment to pre-set goals. Saalt’s platform is set up in a way to provide great assistance in at least two of these three goals, namely planning and monitoring of your financial objectives.
Blibliography
- Biljanovska, Nina and Spyros Palligkinis. 2015. Control Thyself: Self-Control Failure and Household Wealth, Working Paper.
- Black, Fischer and Robert Litterman, 1992, Global Portfolio Optimization, Financial Analysts Journal, Vol. 48, No. 5, pp. 28-43.
- Carroll, Christopher, and Andrew Samwick. 1997. The nature of precautionary wealth. Journal of Monetary Economics, Elsevier, vol. 40(1), pages 41-71, September.
- Campbell, John and Luis Viceira. 2002. Strategic Asset Allocation: Portfolio Choice for Long-Term Investors. Oxford University Press, Oxford.
- Campbell, John, Joao Cocco, Francisco Gomes, and Pascal Maenhout. 2001. Investing Retirement Wealth: A Life-Cycle Model. Chapter 11 in John Campbell and Martin Feldstein eds. Risk Aspects of Investment-Based Social Security Reform. University of Chicago Press, Chicago.
- He, Guangliang and Robert Litterman, 1999, The Intuition Behind the Black-Litterman Model Portfolios, Working Paper.
- Sohn, Alexander, Nadja Klein, and Thomas Kneib. 2014. A New Semiparametric Approach to Analysing Conditional Income Distributions. DIW: SOEP papers nr. 676.
- Zainhofer, Florian. 2008. Life Cycle Investing and Occupational Old-Age Provision in Switzerland. Gabler, Wiesbaden.